Monitoring and operations
Atmosphere includes a Grafana deployment with dashboards created by default and a Prometheus deployment that collects metrics from the cluster and sends alerts to Alertmanager. Loki also collects logs from the cluster using Vector.
Philosophy and alerting levels
Atmosphere’s monitoring philosophy is strongly aligned with the principles outlined in the Google Site Reliability Engineering (SRE) book. The approach focuses on alerting that’s meaningful, practical, and directly tied to user-visible impact.
Alerting philosophy
Symptom-based alerting
Symptom-based alerts take priority over cause-based alerts. They focus on conditions that directly affect users or service health, such as elevated error rates or increased latency, rather than internal system state.
Cause-based alerts are acceptable only when no reasonable symptom-based proxy exists, or when they serve as leading indicators for capacity planning (typically P4 or P5).
Error budget driven alerting
When service-level objectives (SLOs) exist for a service, burn-rate alerts work better than static threshold alerts. A burn-rate alert fires when the error budget depletes faster than expected, which accounts for baseline error rates and avoids alerting on acceptable levels of degradation.
Escalation model
The alerting system scales severity with impact. Most alerts affecting a single system trigger a lower priority level (P4 or P5). If an issue affects the entire control plane of a specific service, it escalates to a P3 or P2. If a service is entirely unavailable, it becomes a P1.
Inhibition and grouping
Alerts have dependency awareness. When a parent component fails (for example, a node goes down), inhibition rules in Alertmanager suppress child component alerts (for example, pods on that node) to avoid cascading alert storms. The system groups related alerts so that a single notification represents a coherent incident rather than dozens of individual symptoms.
Minimizing noise
Minimizing alert noise keeps every notification meaningful and worthy of action. Every alert should provide enough information to initiate an immediate and effective response, regardless of business hours for high priority alerts.
Monitoring and alerting strategies improve over time to better identify and respond to incidents. The ultimate goal is to provide a reliable and high-quality service to all users.
Severity levels
The alerting system classifies incidents into different severity levels based on their impact on the system and users.
- P1: Critical
This level covers incidents causing a complete service disruption or significant loss of functionality across the entire Atmosphere platform. Immediate response, attention, and action are necessary regardless of business hours.
Notification: Page to on-call engineer with escalation.
- P2: High
This level is for incidents that affect a large group of users or critical system components. These incidents require swift attention and action, regardless of business hours, but don’t cause a total disruption.
Notification: Page to on-call engineer.
- P3: Moderate
This level is for incidents that affect a smaller group of users or a single system. These incidents require attention and may necessitate action during business hours.
Notification: Alert channel with mention.
- P4: Low
This level covers minor issues that have a limited impact on a small subset of users or system functionality. These incidents require attention and action, if necessary, during standard business hours.
Notification: Alert channel, no mention.
- P5: Informational
This is the lowest level of severity, used for providing information about normal system activities or minor issues that don’t significantly impact users or system functionality. These incidents typically don’t require immediate attention or action and operators address them during standard business hours.
Notification: Informational channel or email digest.
Operational procedures
Creating silences
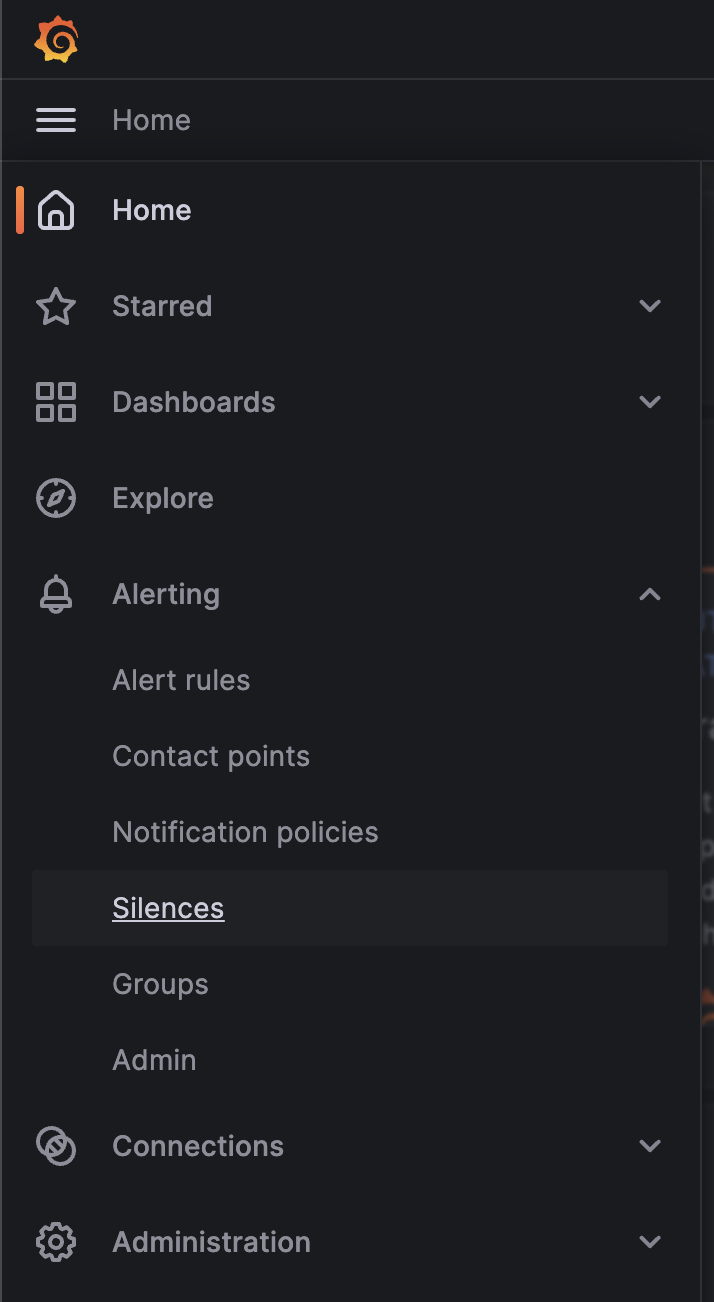
To create a silence, log in to your Grafana instance that Atmosphere deploys as an admin user.
Click on the hamburger menu in the top left corner and select “Alerting” and then “Silences” from the menu.
Make sure that you select “Alertmanager” on the top right corner of the page, this ensures that you create a silence inside of the Alertmanager that’s managed by the Prometheus operator instead of the built-in Grafana Alertmanager which isn’t used.
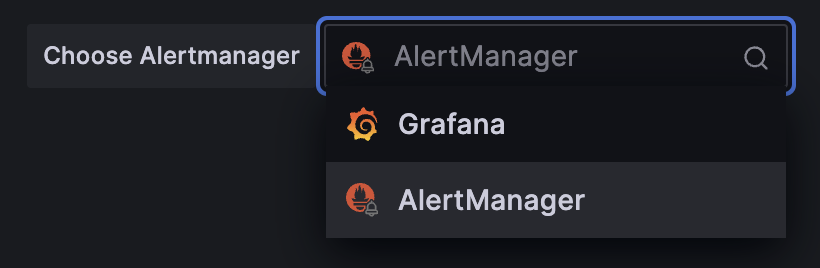
Alertmanager selection
It’s important that you select the Alertmanager that’s managed by the Prometheus operator, otherwise your silence won’t apply to the Prometheus instance that Atmosphere deploys.
Click the “Add Silence” button and use the Alertmanager format to create your silence, which you can test by seeing if it matches any alerts in the list labeled “Affected alert instances”.
Limit the number of labels
It’s important to limit the number of labels that you use in your silence to make sure it continues to work even if the alerts change.
For example, if you have an alert that carries the following labels:
alertnameinstancejobseverity
You should only use the alertname and severity labels in your
silence to make sure it continues to work even if the instance
or job labels change.
Configurations
Dashboard management
For Grafana, rather than enabling persistence through the application’s user interface or manual Helm chart modifications, manage dashboards directly via the Helm chart values.
Avoid Manual Persistence Configurations!
It’s important to avoid manual persistence configurations, especially for services like Grafana, where dashboards and data sources can persist. Such practices aren’t captured in version control and pose a risk of data loss, configuration drift, and upgrade complications.
To manage Grafana dashboards through Helm, include the dashboard definitions within your configuration file. This approach enables version-controlled dashboard configurations that you can replicate across different deployments without manual intervention.
For example, you can define a dashboard in the Helm values like this:
kube_prometheus_stack_helm_values:
  grafana:
    dashboards:
      default:
        my-dashboard:
          gnetId: 10000
          revision: 1
          datasource: Prometheus
This instructs Helm to fetch and configure the specified dashboard from Grafana.com dashboards, using Prometheus as the data source. You can find more examples of how to do this in the Grafana Helm chart Import Dashboards documentation.
Viewing data
The monitoring stack offers a few different ways to view collected data. The most common ways are through Alertmanager, Grafana, and Prometheus.
Grafana dashboard
By default, Atmosphere creates an Ingress for Grafana using the
kube_prometheus_stack_grafana_host variable. Keycloak handles
authentication, and Atmosphere deploys it by default.
Inside Keycloak, Atmosphere creates two client roles for Grafana:
grafana:adminHas access to all organization resources, including dashboards, users, and teams.
grafana:editorCan view and edit dashboards, folders, and playlists.
grafana:viewerCan view dashboards, playlists, and query data sources.
You can view the existing dashboards by going to Manage > Dashboards. You can also check any alerts that are currently firing by going to Alerting > Alerts.
Prometheus
By default, Prometheus sits behind an Ingress using the
kube_prometheus_stack_prometheus_host variable. It also runs behind the
oauth2-proxy service, which handles authentication so that only authenticated
users can access the Prometheus UI.
Alternative authentication
You can bypass the oauth2-proxy service and use an alternative authentication
method to access the Prometheus UI. In both cases, you override the
servicePort on the Ingress to point to the port where Prometheus runs
instead of the oauth2-proxy service.
Advanced Usage Only
It’s strongly recommended that you stick to keeping the oauth2-proxy service in front of the Prometheus UI. The oauth2-proxy service is responsible for authenticating users and ensuring that only authenticated users can access the Prometheus UI.
Basic authentication
To use basic authentication for the Prometheus UI instead of the oauth2-proxy service with single sign-on, make the following changes to your inventory:
kube_prometheus_stack_helm_values:
  prometheus:
    ingress:
      servicePort: 8080
      annotations:
        nginx.ingress.kubernetes.io/auth-type: basic
        nginx.ingress.kubernetes.io/auth-secret: basic-auth-secret-name
In this example, the basic-auth-secret-name secret handles user
authentication. Create the secret in the same namespace as the Prometheus
deployment based on the Ingress NGINX annotations.
Restricting by address
To restrict Prometheus UI access to specific IP addresses, make the following changes to your inventory:
kube_prometheus_stack_helm_values:
  prometheus:
    ingress:
      servicePort: 8080
      annotations:
        nginx.ingress.kubernetes.io/whitelist-source-range: "10.0.0.0/24,172.10.0.1"
In this example, the configuration restricts access to the IP range
10.0.0.0/24 and the IP address 172.10.0.1.
Alertmanager
By default, the Alertmanager dashboard points to the Ansible variable
kube_prometheus_stack_alertmanager_host and sits behind an Ingress
with the oauth2-proxy service, protected by Keycloak similar to Prometheus.
Integrations
Since Atmosphere relies on Alertmanager to send alerts, you can integrate it with services like OpsGenie, PagerDuty, email, and more. To receive monitoring alerts using your preferred notification tools, integrate them with Alertmanager.
OpsGenie
To get started, complete the following steps inside OpsGenie:
Create an integration inside OpsGenie, you can do this by going to Settings > Integrations > Add Integration and selecting Prometheus.
Copy the API key that OpsGenie generates for you and set up correct assignment rules inside OpsGenie.
Create a new heartbeat inside OpsGenie, you can do this by going to Settings > Heartbeats > Create Heartbeat. Set the interval to 1 minute.
Afterward, configure the following options for the Atmosphere config,
making sure that you replace the placeholders with the correct values:
API_KEYThe API key that you copied from the OpsGenie integration.
HEARTBEAT_NAMEThe name of the heartbeat that you created inside OpsGenie
kube_prometheus_stack_helm_values:
  alertmanager:
    config:
      receivers:
        - name: "null"
        - name: notifier
          opsgenie_configs:
            - api_key: API_KEY
              message: >-
                {% raw -%}
                {{ .GroupLabels.alertname }}
                {%- endraw %}
              priority: >-
                {% raw -%}
                {{- if eq .GroupLabels.severity "critical" -}}
                P1
                {{- else if eq .GroupLabels.severity "warning" -}}
                P3
                {{- else if eq .GroupLabels.severity "info" -}}
                P5
                {{- else -}}
                {{ .GroupLabels.severity }}
                {{- end -}}
                {%- endraw %}
              description: |-
                {% raw -%}
                {{ if gt (len .Alerts.Firing) 0 -}}
                Alerts Firing:
                {{ range .Alerts.Firing }}
                  - Message: {{ .Annotations.message }}
                    Labels:
                {{ range .Labels.SortedPairs }}   - {{ .Name }} = {{ .Value }}
                {{ end }}   Annotations:
                {{ range .Annotations.SortedPairs }}   - {{ .Name }} = {{ .Value }}
                {{ end }}   Source: {{ .GeneratorURL }}
                {{ end }}
                {{- end }}
                {{ if gt (len .Alerts.Resolved) 0 -}}
                Alerts Resolved:
                {{ range .Alerts.Resolved }}
                  - Message: {{ .Annotations.message }}
                    Labels:
                {{ range .Labels.SortedPairs }}   - {{ .Name }} = {{ .Value }}
                {{ end }}   Annotations:
                {{ range .Annotations.SortedPairs }}   - {{ .Name }} = {{ .Value }}
                {{ end }}   Source: {{ .GeneratorURL }}
                {{ end }}
                {{- end }}
                {%- endraw %}
        - name: heartbeat
          webhook_configs:
            - url: https://api.opsgenie.com/v2/heartbeats/HEARTBEAT_NAME/ping
              send_resolved: false
              http_config:
                basic_auth:
                  password: API_KEY
Once you deploy the changes, you’ll start to see alerts inside OpsGenie and you can also verify that the heartbeat shows as ACTIVE.
PagerDuty
To integrate with PagerDuty, first prepare an Integration key. To do that, decide how you want to integrate with PagerDuty since there are two ways:
- Event Orchestration
This method is beneficial if you want to build different routing rules based on the events coming from the integrated tool.
- PagerDuty Service Integration
This method is beneficial if you don’t need to route alerts from the integrated tool to different responders based on the event payload.
For both of these methods, you need to create an Integration key in PagerDuty using the PagerDuty Integration Guide.
Once you’re done, you’ll need to configure the inventory with the following options:
kube_prometheus_stack_helm_values:
  alertmanager:
    config:
      receivers:
        - name: notifier
          pagerduty_configs:
            - service_key: '<your integration key here>'
You can find more details about
pagerduty_configs in the Prometheus documentation.
Email
To integrate with email, you need to configure the following options in the inventory:
kube_prometheus_stack_helm_values:
  alertmanager:
    config:
      receivers:
        - name: notifier
          email_configs:
            - smarthost: 'smtp.gmail.com:587'
              auth_username: '<your email id here>'
              auth_password: '<your email password here>'
              from: '<your email id here>'
              to: '<receiver's email id here>'
              headers:
                subject: 'Prometheus Mail Alerts'
You can find more details about
email_configs in the Prometheus documentation.
Alerts reference
CoreDNSCriticalErrorBudgetBurn
This alert fires when the CoreDNS SERVFAIL rate exceeds 14.4x the burn rate for a 99.9% SLO. At this rate, the 30-day error budget exhausts in under 2.1 days. It uses multi-window burn-rate detection with 1-hour and 5-minute windows.
Likely root causes
Upstream DNS servers are unreachable or returning errors
CoreDNS configuration errors after a recent change
Network connectivity issues between CoreDNS and upstream resolvers
Resource exhaustion (CPU or memory) on CoreDNS pods
Diagnostic and remediation steps
Check CoreDNS pod health and logs:
kubectl -n kube-system get pods -l k8s-app=kube-dns
kubectl -n kube-system logs -l k8s-app=kube-dns --tail=100
Verify upstream DNS server connectivity:
kubectl -n kube-system exec -it deploy/coredns -- nslookup example.comCheck the current SERVFAIL rate:
kubectl -n monitoring exec svc/kube-prometheus-stack-prometheus -- \
  promtool query instant http://localhost:9090 \
  'sum(rate(coredns_dns_responses_total{rcode="SERVFAIL"}[5m])) / sum(rate(coredns_dns_responses_total[5m]))'
Review CoreDNS ConfigMap for configuration issues:
kubectl -n kube-system get configmap coredns -o yamlRestart CoreDNS pods if configuration looks correct:
kubectl -n kube-system rollout restart deployment coredns
CoreDNSDown
This alert fires when CoreDNS disappears from Prometheus target discovery for more than 15 minutes. This could indicate crashed pods or an incorrectly configured scrape target.
Likely root causes
CoreDNS pods crashed or aren’t scheduling
Prometheus scrape configuration changed
Node-level issues preventing pod scheduling
Resource limits causing out-of-memory termination
Diagnostic and remediation steps
Check CoreDNS pod status:
kubectl -n kube-system get pods -l k8s-app=kube-dns
kubectl -n kube-system describe pods -l k8s-app=kube-dns
Check for out-of-memory events:
kubectl -n kube-system get events --field-selector reason=OOMKillingVerify Prometheus can reach the CoreDNS metrics endpoint:
kubectl -n monitoring exec svc/kube-prometheus-stack-prometheus -- \
  promtool query instant http://localhost:9090 'up{job="coredns"}'
Check node availability if pods aren’t scheduling:
kubectl get nodes -o wide
CoreDNSHighErrorBudgetBurn
This alert fires when the CoreDNS SERVFAIL rate exceeds 6x the burn rate for a 99.9% SLO. At this rate, the 30-day error budget exhausts in under 5 days. It uses multi-window burn-rate detection with 6-hour and 30-minute windows.
Likely root causes
Intermittent upstream DNS server issues
Partial network connectivity problems
DNS zone transfer failures
Upstream rate limiting
Diagnostic and remediation steps
Check CoreDNS logs for recurring errors:
kubectl -n kube-system logs -l k8s-app=kube-dns --tail=200 | grep -i errorCheck the SERVFAIL rate broken down over time:
kubectl -n monitoring exec svc/kube-prometheus-stack-prometheus -- \
  promtool query instant http://localhost:9090 \
  'sum(rate(coredns_dns_responses_total{rcode="SERVFAIL"}[30m])) / sum(rate(coredns_dns_responses_total[30m]))'
Verify upstream DNS server health by testing resolution:
kubectl -n kube-system exec -it deploy/coredns -- nslookup example.comReview CoreDNS forward plugin configuration:
kubectl -n kube-system get configmap coredns -o yaml
CoreDNSLowErrorBudgetBurn
This alert fires when the CoreDNS SERVFAIL rate exceeds 1x the burn rate for a 99.9% SLO. At this rate, the error budget exhausts before the 30-day window resets. It uses multi-window burn-rate detection with 3-day and 6-hour windows.
Likely root causes
Chronic low-level DNS resolution failures
Specific zones or domains consistently failing
Degraded upstream DNS server performance
Incorrectly configured DNS records causing intermittent failures
Diagnostic and remediation steps
Identify which DNS queries are failing:
kubectl -n kube-system logs -l k8s-app=kube-dns --tail=500 | grep SERVFAILCheck the long-term SERVFAIL trend:
kubectl -n monitoring exec svc/kube-prometheus-stack-prometheus -- \
  promtool query instant http://localhost:9090 \
  'sum(rate(coredns_dns_responses_total{rcode="SERVFAIL"}[6h])) / sum(rate(coredns_dns_responses_total[6h]))'
Review if specific upstream servers are consistently problematic:
kubectl -n monitoring exec svc/kube-prometheus-stack-prometheus -- \
  promtool query instant http://localhost:9090 \
  'sum by (to) (rate(coredns_forward_responses_total{rcode="SERVFAIL"}[6h]))'
CoreDNSModerateErrorBudgetBurn
This alert fires when the CoreDNS SERVFAIL rate exceeds 3x the burn rate for a 99.9% SLO. At this rate, the 30-day error budget exhausts in under 10 days. It uses multi-window burn-rate detection with 1-day and 2-hour windows.
Likely root causes
Degraded upstream DNS server responding with errors
Network path issues causing intermittent resolution failures
DNS zone configuration errors causing partial failures
Resource pressure on CoreDNS pods
Diagnostic and remediation steps
Check CoreDNS resource usage:
kubectl -n kube-system top pods -l k8s-app=kube-dnsReview the SERVFAIL rate trend over the last day:
kubectl -n monitoring exec svc/kube-prometheus-stack-prometheus -- \
  promtool query instant http://localhost:9090 \
  'sum(rate(coredns_dns_responses_total{rcode="SERVFAIL"}[2h])) / sum(rate(coredns_dns_responses_total[2h]))'
Check forward plugin health:
kubectl -n monitoring exec svc/kube-prometheus-stack-prometheus -- \
  promtool query instant http://localhost:9090 \
  'sum(rate(coredns_forward_healthcheck_failures_total[2h]))'
Review CoreDNS logs for patterns:
kubectl -n kube-system logs -l k8s-app=kube-dns --tail=300 | grep -i "error\|fail"
etcdDatabaseHighFragmentationRatio
This alert fires when the etcd database has a high fragmentation ratio that can cause performance issues on the cluster. To resolve this issue, use the following command:
kubectl -n kube-system exec svc/kube-prometheus-stack-kube-etcd -- \
  etcdctl defrag \
  --cluster \
  --cacert /etc/kubernetes/pki/etcd/ca.crt \
  --key /etc/kubernetes/pki/etcd/server.key \
  --cert /etc/kubernetes/pki/etcd/server.crt
EtcdMembersDown
If any alerts fire from Prometheus for etcd issues such as TargetDown,
etcdMembersDown, or etcdInsufficientMembers, it could be due to expired
certificates. You can update the certificates that kube-prometheus-stack uses for
talking with etcd with the following commands:
kubectl -n monitoring delete secret/kube-prometheus-stack-etcd-client-cert
kubectl -n monitoring create secret generic kube-prometheus-stack-etcd-client-cert \
    --from-file=/etc/kubernetes/pki/etcd/ca.crt \
    --from-file=/etc/kubernetes/pki/etcd/healthcheck-client.crt \
    --from-file=/etc/kubernetes/pki/etcd/healthcheck-client.key
GeneveTransmitErrors
This alert fires when a node-exporter device meets both of these
conditions:
The
ethtoolcollector reports it as aGeneveinterface.The
netdevcollector reports more than 1.67 transmit errors per second over a 5-minute window, sustained for 15 minutes.
That rate equates to about 100 errors per minute.
This is a symptom proxy for tenant overlay transmit failures on a compute host.
It’s not specific to one root cause: the Linux Geneve transmit path
increments errors when encapsulation or underlay transmit fails.
Likely Root Causes
Underlay bond or path
MTUis too small for encapsulatedGenevetraffic.Route lookup or underlay connectivity failure for the tunnel destination.
Genevesocket orOpen vSwitchdatapathproblem on the affected host.NICdriver, firmware, or offload issue on the underlay link.
Diagnostic and Remediation Steps
Identify the affected node,
Genevedevice, and error rate:kubectl -n monitoring exec svc/kube-prometheus-stack-prometheus -- \ promtool query instant http://localhost:9090 \ '(rate(node_network_transmit_errs_total[5m]) * on(instance, device) group_left(driver) node_ethtool_info{driver="geneve"})'
On the node, inspect the
Geneveinterface reported by the alert:ip -d link show <geneve-device>For
OVN/Open vSwitch, the systemGenevedevice usually appears asgenev_sys_<udp-port>and showsgeneve external. OtherGeneveinterfaces, such asCiliumtunnel devices, may also match this alert because the selector intentionally uses theethtooldriver="geneve"label rather than an interface-name convention.Confirm the underlay
MTUis large enough for the encapsulated traffic:ip -d link show bond0 ip -d link show bond0.4092
If the bond
MTUis below the fleet-canonical value (typically 9216 on jumbo deployments), correct thenetplanor interfaces configuration and reapply, then verify withip -d link show bond0.Check for an existing
MTUconsistency alert, such asCephNodeInconsistentMTU, and comparenode_network_mtu_bytesacross peers if multiple hosts show the same symptoms.If
MTUis correct, inspectOpen vSwitchand the underlay device fordatapathor offload failures:ovs-appctl dpctl/show -s ovs-vsctl show ethtool -S bond0
GoldpingerHighErrorRate
This alert fires when more than 5% of Goldpinger ping attempts are failing for at least 15 minutes, indicating network connectivity issues across the cluster.
Likely Root Causes
Intermittent network connectivity issues
DNS resolution failures
Firewall rules blocking ICMP or health check traffic
Goldpinger pods experiencing resource constraints
Node-level network stack issues
Diagnostic and Remediation Steps
Check error rates by node to identify patterns:
kubectl -n monitoring exec svc/kube-prometheus-stack-prometheus -- \
  promtool query instant http://localhost:9090 \
  'sum by (instance) (rate(goldpinger_errors_total{type="ping"}[5m]))'
Verify Goldpinger pods are healthy:
kubectl -n monitoring get pods -l app.kubernetes.io/name=goldpinger
kubectl -n monitoring describe pods -l app.kubernetes.io/name=goldpinger
Check for any network policies that might be blocking traffic:
kubectl get networkpolicies --all-namespacesReview Goldpinger logs for specific error messages:
kubectl -n monitoring logs -l app.kubernetes.io/name=goldpinger --tail=100Check if the errors correlate with specific target nodes by examining which targets have high latency:
kubectl -n monitoring exec svc/kube-prometheus-stack-prometheus -- \
  promtool query instant http://localhost:9090 \
  'topk(10, histogram_quantile(0.95, sum by (instance, host_ip, le) (rate(goldpinger_peers_response_time_s_bucket{call_type="ping"}[5m]))))'
GoldpingerHighPeerLatency
This alert fires when the 95th percentile of Goldpinger peer-to-peer latency exceeds 500ms for at least 15 minutes, indicating network congestion or performance issues.
Likely Root Causes
Network congestion on the cluster network
Overloaded network switches or routers
High CPU or I/O load on nodes causing delayed responses
Network interface saturation
Incorrect network Quality of Service (QoS) configuration
Diagnostic and Remediation Steps
Check which node pairs have the highest latency:
kubectl -n monitoring exec svc/kube-prometheus-stack-prometheus -- \
  promtool query instant http://localhost:9090 \
  'topk(10, histogram_quantile(0.95, sum by (instance, host_ip, le) (rate(goldpinger_peers_response_time_s_bucket{call_type="ping"}[5m]))))'
Check node-exporter metrics for network saturation:
kubectl -n monitoring exec svc/kube-prometheus-stack-prometheus -- \
  promtool query instant http://localhost:9090 \
  'rate(node_network_transmit_bytes_total[5m])'
Review CPU and I/O wait metrics on affected nodes:
kubectl -n monitoring exec svc/kube-prometheus-stack-prometheus -- \
  promtool query instant http://localhost:9090 \
  'sum by (instance) (rate(node_cpu_seconds_total{mode="iowait"}[5m]))'
Check for network drops which may indicate congestion:
kubectl -n monitoring exec svc/kube-prometheus-stack-prometheus -- \
  promtool query instant http://localhost:9090 \
  'rate(node_network_receive_drop_total[5m]) > 0'
If latency is consistently high between specific node pairs, investigate the network path between them for hardware issues or configuration errors.
GoldpingerHighUnhealthyRatio
This alert fires when more than 10% of nodes in the cluster are reporting as unhealthy according to Goldpinger health checks for at least 5 minutes.
Likely Root Causes
Widespread network connectivity issues affecting multiple nodes
A network partition isolating a segment of the cluster
Multiple nodes experiencing high load or resource exhaustion
Infrastructure-level network problems (switch failures, routing issues)
Diagnostic and Remediation Steps
Check the Goldpinger dashboard in Grafana to visualize which nodes are affected and the connectivity patterns.
Query Prometheus to identify which specific nodes are reporting unhealthy:
kubectl -n monitoring exec svc/kube-prometheus-stack-prometheus -- \
  promtool query instant http://localhost:9090 \
  'goldpinger_nodes_health_total{status="unhealthy"} > 0'
Check for network issues on the affected nodes:
kubectl get nodes -o wide
kubectl describe node <affected-node>
Review node-exporter metrics for network errors or drops:
kubectl -n monitoring exec svc/kube-prometheus-stack-prometheus -- \
  promtool query instant http://localhost:9090 \
  'rate(node_network_receive_errs_total[5m]) > 0'
If the issue affects only specific nodes, check their network configuration and physical connectivity.
GoldpingerNodeUnreachable
This alert fires when more than 50% of Goldpinger instances can’t reach a specific node for at least 5 minutes. The target node may be down or experiencing network issues.
Likely Root Causes
The target node is down or unresponsive
Network interface failure on the target node
Firewall or security group configuration error blocking traffic
The Goldpinger pod on the target node has crashed
Diagnostic and Remediation Steps
Identify the affected node by its IP address from the alert labels:
kubectl get nodes -o wide | grep <host_ip>Check if the node is reachable and healthy:
kubectl get node <node-name>
kubectl describe node <node-name>
Verify the Goldpinger pod is running on the affected node:
kubectl -n monitoring get pods -l app.kubernetes.io/name=goldpinger \
  -o wide | grep <node-name>
Check network connectivity from another node:
kubectl debug node/<healthy-node> -it --image=busybox -- \
  ping -c 3 <affected-node-ip>
Review system logs on the affected node for network or kernel issues:
kubectl debug node/<affected-node> -it --image=busybox -- \
  cat /host/var/log/syslog | tail -100
IpmiUncorrectableMemoryError
This alert fires when the Intelligent Platform Management Interface (IPMI)
exporter reports a recent uncorrectable_memory_error System Event Log
(SEL) event. These events
indicate a non-recoverable memory error on the host and often require
hardware intervention.
Likely Root Causes
Failing dual in-line memory module (DIMM) or memory controller
Unstable firmware or Basic Input/Output System (BIOS) configuration
Recent hardware changes or maintenance introducing faulty memory
Diagnostic and Remediation Steps
Identify the affected host from the alert
instancelabel.Check the SEL (System Event Log) on the host for uncorrectable memory errors:
ipmitool sel list | grep -i "uncorrectable"Review system logs for error-correcting code (ECC) or memory errors:
journalctl -k | grep -i -e ecc -e memory -e edacIf the error recurs, replace the failing DIMM (dual in-line memory module) and run a memory test (for example,
memtest86) before returning the host to service.
IpmiUnrecoverableCpuError
This alert fires when the IPMI (Intelligent Platform Management Interface)
exporter reports a recent unrecoverable_cpu_error SEL (System Event Log)
event. These events
indicate a fatal CPU error that typically requires hardware
intervention and may precede a crash.
Likely Root Causes
Failing CPU or socket
Hardware instability due to power or thermal issues
Firmware or microcode issues
Diagnostic and Remediation Steps
Identify the affected host from the alert
instancelabel.Check the SEL (System Event Log) on the host for CPU errors:
ipmitool sel list | grep -i -e "processor" -e "err"Review system logs for machine check or CPU errors:
journalctl -k | grep -i -e mce -e machine -e cpuCheck CPU temperatures and system health:
ipmitool sdr type temperature
ipmitool sdr type processor
If the error recurs, schedule hardware maintenance and replace the affected CPU or motherboard as needed.
MySQLGaleraOutOfSync
This alert fires when a Percona XtraDB Cluster (PXC) Galera node has a
wsrep_local_state that’s not 4 (Synced) and not 2 (Donor), while
wsrep_desync isn’t enabled. The alert excludes state 2 (Donor) because
it’s a normal transient state during donor operations for State Snapshot
Transfer (SST) or PXC operator backups. The separate
MySQLGaleraDonorFallingBehind alert covers problematic donor
scenarios.
This is a cause-based alert because no reasonable symptom-based proxy exists for a Galera node losing cluster sync. The cluster may continue to serve requests with the remaining nodes, but the reduced quorum margin increases the risk of a full outage if another node fails.
Likely Root Causes
A node remains in the Joining state (1) and can’t complete SST.
A node completed SST but hasn’t finished catching up (state 3, Joined) for an extended period.
Network partitioning prevents the node from rejoining the cluster.
Corrupted Galera cache or write-set replication failure.
Diagnostic and Remediation Steps
Check the current
wsrep_local_stateon the affected node:kubectl -n openstack exec -it percona-xtradb-pxc-0 -- \ mysql -e "SHOW STATUS LIKE 'wsrep_local_state%';"
Check overall cluster status:
kubectl -n openstack exec -it percona-xtradb-pxc-0 -- \
  mysql -e "SHOW STATUS LIKE 'wsrep_cluster%';"
Review the PXC pod logs for the affected replica:
kubectl -n openstack logs percona-xtradb-pxc-<N> --tail=200If the node remains in Joining state, it may need an SST restart. Delete the affected pod to trigger a fresh SST:
kubectl -n openstack delete pod percona-xtradb-pxc-<N>Verify that no PXC backup runs at the moment (a backup puts a node into Donor state, which the
MySQLGaleraDonorFallingBehindalert covers):kubectl -n openstack get pxc-backup
NodeDiskHighLatency
This alert fires when the average IO latency on a disk device exceeds 20ms for at least 1 hour. It measures the time the kernel spends servicing reads and writes divided by the number of completed operations, which represents the true per-operation latency at the block device layer.
Likely root causes:
Failing or degraded SSD or HDD (wear-out, bad sectors, firmware issues)
RAID array running in degraded mode after a disk failure
Storage controller problems
Severely overloaded storage subsystem (too many concurrent IO operations)
Incorrect IO scheduler for the workload type
Diagnostic and remediation steps:
Identify the affected host and device from the alert labels (
instanceanddevice).Check the current IO latency and throughput on the affected device:
iostat -xz 1 5Check for disk errors in the kernel log:
dmesg | grep -i -E "error|fault|reset|i/o" | tail -30If the device is part of a RAID array, check the array status:
cat /proc/mdstatCheck the SMART health status of the underlying drives:
smartctl -a /dev/<device>Review whether the host is under unusual IO load:
iotop -aoPIf the disk shows degradation or failure, plan a replacement. For RAID arrays, replace the failed member. For standalone disks, migrate workloads before the disk fails completely.
NodeMemoryHighUtilization
This alert fires when computed node memory utilization exceeds 90% for at
least 15 minutes. The calculation uses normal available memory
(node_memory_MemAvailable_bytes) plus free huge page capacity
(node_memory_HugePages_Free * node_memory_Hugepagesize_bytes), then compares
it with total memory. If huge page metrics are absent on a node, the alert
automatically falls back to MemAvailable-only behavior. This avoids false
positives on compute nodes that intentionally reserve large huge page pools for
VM workloads while preserving normal behavior elsewhere.
Likely Root Causes
Real host-level memory pressure from application or system processes.
Workload density increase that reduced both normal free memory and free huge pages.
Memory leak in host services, virtualization daemons, or VM workloads.
Unexpected huge page consumption reducing the free huge page pool.
Diagnostic and Remediation Steps
Identify the affected node from the alert
instancelabel.Validate memory pressure from Prometheus metrics:
kubectl -n monitoring exec svc/kube-prometheus-stack-prometheus -- \
  promtool query instant http://localhost:9090 \
  '(1 - ((node_memory_MemAvailable_bytes{instance="<instance>",job="node-exporter"} + (node_memory_HugePages_Free{instance="<instance>",job="node-exporter"} * node_memory_Hugepagesize_bytes{instance="<instance>",job="node-exporter"})) / node_memory_MemTotal_bytes{instance="<instance>",job="node-exporter"})) * 100'
Inspect current host memory and huge page usage:
free -h
grep -E 'HugePages_(Total|Free|Rsvd|Surp)|Hugepagesize' /proc/meminfo
Identify the top memory consumers on the host:
ps aux --sort=-rss | head -20If huge page usage depletes the free pool, investigate VM placement and compute scheduling changes. If normal memory runs out, move workloads, increase host capacity, or resolve memory leaks.
NginxIngressCriticalErrorBudgetBurn
This alert fires when a service behind NGINX Ingress consumes its 30-day error budget at more than 14.4x the sustainable rate, based on a 99.9% availability SLO. It uses multi-window burn-rate detection with 1-hour and 5-minute windows to confirm the issue is both sustained and ongoing. At this burn rate, the entire 30-day error budget exhausts in under 2.1 days. A minimum traffic guard of 1 request per second prevents false positives on low-traffic services.
Likely Root Causes
Service pods are crashing or in a crash loop
Database connection failures affecting all service replicas
Configuration errors in the service deployment
Resource exhaustion (CPU, memory, or file descriptors) on service pods
Network connectivity failures between NGINX and service pods
Service code bugs causing widespread failures
Diagnostic and Remediation Steps
Check the alert labels to identify the affected service and query the current error rate:
kubectl -n monitoring exec svc/kube-prometheus-stack-prometheus -- \
  promtool query instant http://localhost:9090 \
  'sum by (service) (rate(nginx_ingress_controller_requests{status=~"5[0-9]{2}"}[1h])) / sum by (service) (rate(nginx_ingress_controller_requests[1h]))'
Check the health and status of the backend service pods:
kubectl get pods -A | grep <service-name>
kubectl describe pod <pod-name> -n <namespace>
Review recent logs from the affected service pods:
kubectl logs -n <namespace> <pod-name> --tail=100Check NGINX Ingress controller logs for upstream connection errors:
kubectl logs -n ingress-nginx -l app.kubernetes.io/name=ingress-nginx --tail=200Verify resource usage on the backend service pods:
kubectl top pods -n <namespace> | grep <service-name>If the issue persists, consider scaling the service or restarting affected pods to attempt recovery while investigating the root cause.
NginxIngressHighErrorBudgetBurn
This alert fires when a service behind NGINX Ingress consumes its 30-day error budget at more than 6x the sustainable rate, based on a 99.9% availability SLO. It uses multi-window burn-rate detection with 6-hour and 30-minute windows to confirm the issue is both sustained and ongoing. At this burn rate, the entire 30-day error budget exhausts in under 5 days. A minimum traffic guard of 1 request per second prevents false positives on low-traffic services.
Likely Root Causes
Intermittent issues with a subset of service replicas
Occasional database query timeouts or connection pool exhaustion
Resource pressure on some service pods
Networking issues affecting specific nodes or pods
Recent deployment causing partial service degradation
Cache or session storage issues
Diagnostic and Remediation Steps
Check the current error rate by service:
kubectl -n monitoring exec svc/kube-prometheus-stack-prometheus -- \
  promtool query instant http://localhost:9090 \
  'sum by (service) (rate(nginx_ingress_controller_requests{status=~"5[0-9]{2}"}[6h])) / sum by (service) (rate(nginx_ingress_controller_requests[6h]))'
Identify which specific HTTP error codes the service returns:
kubectl -n monitoring exec svc/kube-prometheus-stack-prometheus -- \
  promtool query instant http://localhost:9090 \
  'sum by (service, status) (rate(nginx_ingress_controller_requests{status=~"5[0-9]{2}"}[30m]))'
Check for unhealthy or recently restarted pods:
kubectl get pods -A | grep <service-name>
kubectl get events -n <namespace> --sort-by='.lastTimestamp' | grep <service-name>
Review application logs for errors:
kubectl logs -n <namespace> -l app=<service-name> --tail=100 | grep -i errorCheck if the error rate correlates with increased load or specific API endpoints by examining the NGINX Ingress metrics in Grafana.
Verify database connectivity and performance if the service depends on a database:
kubectl exec -it <pod-name> -n <namespace> -- <database-client> -e "SHOW PROCESSLIST;"
NginxIngressLowErrorBudgetBurn
This alert fires when a service behind NGINX Ingress consumes its 30-day error budget at the sustainable rate or faster, based on a 99.9% availability SLO. It uses multi-window burn-rate detection with 3-day and 6-hour windows to confirm the issue is both sustained and ongoing. At this burn rate, the 30-day error budget exhausts before the window resets. A minimum traffic guard of 1 request per second prevents false positives on low-traffic services.
Likely Root Causes
Degrading dependency (database, cache, or external service)
Gradual resource leak causing occasional failures
Configuration drift across replicas
Intermittent infrastructure issues during off-peak hours
Elevated baseline error rate after a deployment
Diagnostic and Remediation Steps
Check the error rate trend over the last 3 days:
kubectl -n monitoring exec svc/kube-prometheus-stack-prometheus -- \
  promtool query instant http://localhost:9090 \
  'sum by (service) (rate(nginx_ingress_controller_requests{status=~"5[0-9]{2}"}[3d])) / sum by (service) (rate(nginx_ingress_controller_requests[3d]))'
Compare the error rate with the previous period to identify when it started increasing by examining trends in Grafana dashboards.
Review recent deployments or configuration changes that correlate with the error rate increase:
kubectl get events -n <namespace> --sort-by='.lastTimestamp' | head -50Check if specific error codes dominate:
kubectl -n monitoring exec svc/kube-prometheus-stack-prometheus -- \
  promtool query instant http://localhost:9090 \
  'sum by (service, status) (rate(nginx_ingress_controller_requests{status=~"5[0-9]{2}"}[6h]))'
Investigate resource usage and dependency health for the affected service.
NginxIngressModerateErrorBudgetBurn
This alert fires when a service behind NGINX Ingress consumes its 30-day error budget at more than 3x the sustainable rate, based on a 99.9% availability SLO. It uses multi-window burn-rate detection with 1-day and 2-hour windows to confirm the issue is both sustained and ongoing. At this burn rate, the entire 30-day error budget exhausts in under 10 days. A minimum traffic guard of 1 request per second prevents false positives on low-traffic services.
Likely Root Causes
A subset of service replicas returning errors intermittently
Slow database queries causing periodic timeouts
Resource contention during peak traffic periods
Partial deployment with a faulty version still in rotation
Upstream dependency experiencing intermittent issues
Diagnostic and Remediation Steps
Check the error rate over the last day:
kubectl -n monitoring exec svc/kube-prometheus-stack-prometheus -- \
  promtool query instant http://localhost:9090 \
  'sum by (service) (rate(nginx_ingress_controller_requests{status=~"5[0-9]{2}"}[1d])) / sum by (service) (rate(nginx_ingress_controller_requests[1d]))'
Identify which error codes the service returns:
kubectl -n monitoring exec svc/kube-prometheus-stack-prometheus -- \
  promtool query instant http://localhost:9090 \
  'sum by (service, status) (rate(nginx_ingress_controller_requests{status=~"5[0-9]{2}"}[2h]))'
Check for unhealthy pods or recent restarts:
kubectl get pods -A | grep <service-name>
kubectl get events -n <namespace> --sort-by='.lastTimestamp' | grep <service-name>
Review application logs for recurring errors:
kubectl logs -n <namespace> -l app=<service-name> --tail=200 | grep -i errorCheck if errors correlate with traffic patterns or specific time windows in Grafana.
Review recent deployments or configuration changes that might have introduced the issue.
NodeNetworkMulticast
This P5 capacity-planning alert fires when an interface receives more than
1,000 multicast or broadcast packets per second for 24 hours. The underlying
node_network_receive_multicast_total counter is driver-provided and can
include layer-2 broadcast traffic such as ARP. The alert therefore does not, by
itself, indicate a multicast application, a network attack, or user-visible
impact.
Common causes include expected multicast protocols, ARP or neighbour discovery on a shared provider network, broadcast unknown multicast (BUM) replication in an EVPN/VXLAN fabric, a layer-2 loop, or a misconfigured or malicious sender. Shared OpenStack provider networks can amplify normal gateway ARP requests to every compute host, so the same traffic can produce one alert per node without overloading any node.
This alert is informational and must not be escalated based on packet rate alone. Page-worthy impact is covered by the softnet backlog and drop alerts, network interface errors, and node CPU alerts. Investigate during business hours to establish a baseline and determine whether capacity work is needed.
Identify the affected interface and confirm its packet and error counters:
DEV=<interface-from-alert>
ip -s link show dev "$DEV"
ethtool -S "$DEV" | grep -Ei 'multicast|broadcast|drop|error|miss'
Capture a bounded sample before deciding that the traffic is multicast. Preserve Ethernet headers so that broadcast ARP can be distinguished from IPv4 or IPv6 multicast:
timeout 30 tcpdump -nn -e -i "$DEV" 'ether multicast' -c 5000Check whether the node is experiencing packet-processing impact. A high packet rate without increasing drops,
time_squeeze, or sustained CPU pressure is a capacity signal rather than an incident:mpstat -P ALL 1 10 watch -n 1 cat /proc/net/softnet_stat ip -s link show dev "$DEV"
If the capture shows tenant traffic, map the source IP or MAC address to an OpenStack port and server:
openstack port list --all-projects --mac-address <source-mac>
openstack server list --all-projects --long --ip <source-ip>
If the capture shows ARP or neighbour discovery from a gateway, inspect the gateway neighbour table and the VXLAN flood list. Failed or incomplete neighbours across unallocated addresses commonly indicate Internet scans causing otherwise normal resolution attempts:
ip neigh show dev <provider-bridge> nud failed
ip neigh show dev <provider-bridge> nud incomplete
bridge -d link show dev <vxlan-interface>
bridge fdb show dev <vxlan-interface>
Compare the measured rate with node CPU, softnet, interface-drop, and VXLAN counters. If there is no impact, record the source and baseline; do not change neighbour retry settings or apply storm control solely to clear this alert. If impact is present, stop a loop or malicious sender when identified, or filter unwanted traffic at the ingress gateway after verifying that the policy cannot block dynamically allocated OpenStack addresses. Longer-term EVPN ARP/ND suppression or routed host prefixes require complete, automatically maintained control-plane bindings.
SmartctlDiskAttributeFailing
This alert fires when a SMART attribute’s normalized value drops at or
below the per-attribute failure threshold the drive firmware itself
defines (smartctl_device_attribute{attribute_value_type="value"} is
<= the matching thresh, where thresh > 0). The drive itself
declares one of its prefailure attributes has crossed into the failing
zone. Common cases are end-of-life wear indicators on SATA SSDs and
reallocation or pending-sector counters whose normalized values have
decayed below the firmware threshold. Suppressed when
SmartctlDiskUnhealthy already fires for the same disk.
Likely Root Causes
SATA SSD wear-out (vendor wearout indicator below threshold)
Sustained reallocation pressure dropping the normalized
Reallocated_Sector_CtvalueAny vendor-specific prefailure attribute the drive deems failing
Diagnostic and Remediation Steps
Identify the affected disk and attribute from the alert labels (
instance,device,attribute_id,attribute_name).Inspect all SMART attributes and note any flagged
FAILING_NOW:smartctl -A /dev/<device>Cross-check with
SmartctlDiskUnhealthy: if both fire, the overall SMART status is also failing. Replace the drive immediately.If only this alert fires, the drive is still functional but the firmware predicts the attribute will continue to degrade. Plan replacement during the next maintenance window.
SmartctlDiskAvailableSpareLow
This alert fires when an NVMe drive’s available_spare percentage drops
below the manufacturer-defined available_spare_threshold. NVMe drives
maintain a pool of spare blocks for media defects. Once that pool nears
exhaustion the controller marks the drive at risk of imminent failure.
Likely Root Causes
The drive is at end-of-life from sustained writes
The drive has experienced an unusually high number of bad blocks
Firmware degradation tracking the drive itself classifies as critical
Diagnostic and Remediation Steps
Identify the affected disk from the alert labels (
instanceanddevice).Review the spare and threshold values:
smartctl -a /dev/<device> | grep -iE 'available_spare'Cross-check the NVMe
critical_warningfield, which the controller sets in parallel:smartctl -a /dev/<device> | grep -i 'critical warning'Migrate any data off the disk and order an emergency replacement. Don’t wait for the next maintenance window.
SmartctlDiskCriticalWarning
This alert fires when an NVMe drive’s critical_warning bitfield is
non-zero. The controller sets bits to indicate available spare below
threshold, temperature over critical, NVM subsystem reliability degraded,
media in read-only mode, or volatile-memory backup failed. Any non-zero
value is the manufacturer’s own signal that the drive is unsafe.
Likely Root Causes
Available spare exhausted (bit 0)
Temperature exceeded the drive’s own critical threshold (bit 1)
NVM subsystem reliability degraded (bit 2)
Media in read-only mode (bit 3)
Volatile-memory backup device failed (bit 4)
Diagnostic and Remediation Steps
Identify the affected disk from the alert labels (
instanceanddevice).Decode the active bit:
smartctl -a /dev/<device> | grep -iA1 'critical warning'Address the underlying cause: cooling for temperature, replacement for reliability/media-read-only/spare-exhausted.
Migrate data and replace the drive. Treat any non-zero
critical_warningas an imminent-failure signal.
SmartctlDiskMediaErrorsGrowing
This alert fires when an NVMe drive’s media_errors counter increased
over the last 24 hours. The counter records occurrences where the
controller couldn’t recover data via ECC. A stable non-zero count from
historical events is harmless, but ongoing growth means the media is
actively degrading.
Likely Root Causes
Media wear at end-of-life
A bad NAND die or controller bug
Sustained high temperatures damaging cells
Diagnostic and Remediation Steps
Identify the affected disk from the alert labels (
instanceanddevice).Confirm the current count and trend:
smartctl -a /dev/<device> | grep -i 'media.*errors'Compare with
smartctl_device_percentage_usedto decide whether wear-out or a localized fault is the cause.Schedule replacement during the next maintenance window. If the rate of growth is high, escalate to immediate replacement.
SmartctlDiskPendingSectorsGrowing
This alert fires when a SATA drive’s Current_Pending_Sector (attribute
197) grew over the last 24 hours. A stable non-zero count is harmless.
The drive remaps those sectors on the next write attempt. Ongoing
growth indicates active media degradation: the drive is encountering new
sectors it can’t read or write reliably.
Likely Root Causes
Physical wear on platters or NAND cells
Mechanical shock or vibration
Read disturb errors on busy SSD blocks
Diagnostic and Remediation Steps
Identify the affected disk from the alert labels (
instanceanddevice).Check the current pending count and other reallocation attributes:
smartctl -A /dev/<device> | grep -iE 'pending|reallocated|uncorrectable'Run a long self-test to force reallocation attempts:
smartctl -t long /dev/<device>Re-check after the test completes (typically a few hours). If pending sectors continue to grow, schedule replacement.
SmartctlDiskReallocatedSectorsGrowing
This alert fires when a SATA drive’s Reallocated_Sector_Ct (attribute
5) grew over the last 24 hours. A stable non-zero value (for example,
factory remapping) is harmless, but ongoing growth means the drive is
actively remapping new bad sectors.
Likely Root Causes
Physical wear or age-related degradation
Mechanical shock or vibration
Overheating causing intermittent write failures
Diagnostic and Remediation Steps
Identify the affected disk from the alert labels (
instanceanddevice).Check the current count and trend:
smartctl -A /dev/<device> | grep -iE 'reallocated|pending'Plan replacement during the next maintenance window. If the count is accelerating, escalate to an unplanned replacement.
SmartctlDiskScsiGrownDefectsGrowing
This alert fires when a SCSI/SAS drive’s grown defect list
(smartctl_scsi_grown_defect_list) gains entries over the last 24
hours. A stable non-zero count is harmless. Ongoing growth means the
drive is actively reallocating bad blocks. This alert is the SAS analog
of SmartctlDiskReallocatedSectorsGrowing.
Likely Root Causes
Mechanical wear on SAS HDD platters
Vibration or shock damage
Approaching end of rated life
Diagnostic and Remediation Steps
Identify the affected disk from the alert labels (
instanceanddevice).Review the defect list and SMART attributes:
smartctl -a /dev/<device>Plan replacement during the next maintenance window. Escalate if growth is accelerating or if
SmartctlDiskScsiUncorrectedErrorsalso fires for the same drive.
SmartctlDiskScsiUncorrectedErrors
This alert fires when a SCSI/SAS drive’s read or write
total-uncorrected-error counter
(smartctl_read_total_uncorrected_errors /
smartctl_write_total_uncorrected_errors) increases over the last 24
hours. Any non-zero growth means the drive couldn’t recover I/O via
on-disk ECC, confirming data loss in the affected blocks.
Likely Root Causes
Severe media degradation
Mechanical or electronics fault
SAS bus errors hammering the drive
Diagnostic and Remediation Steps
Identify the affected disk from the alert labels (
instanceanddevice).Inspect the SCSI error counter log and overall health:
smartctl -l error /dev/<device>
smartctl -a /dev/<device>
Migrate any data off the disk and replace it. Don’t return the drive to service.
SmartctlDiskSelfTestFailed
This alert fires when a SATA drive reports one or more entries in its
SMART self-test error log. Even one failed self-test indicates the
drive couldn’t complete an internal integrity check. The upstream
smartctl_exporter only emits this metric for ATA/SATA drives. NVMe
self-test results aren’t surfaced.
Likely Root Causes
Bad sectors detected during the self-test
Mechanical or electronics fault
Drive firmware or controller errors
Diagnostic and Remediation Steps
Identify the affected disk from the alert labels (
instanceanddevice).Review the self-test log:
smartctl -l selftest /dev/<device>Run a fresh self-test to confirm the failure:
smartctl -t long /dev/<device>If failures persist, plan replacement during the next maintenance window.
SmartctlDiskTemperatureHigh
This alert fires when a disk’s current temperature exceeds 65°C sustained for at least one hour. Brief spikes during heavy I/O are normal, especially on NVMe drives, but sustained high temperatures accelerate flash memory wear and can cause data loss or mechanical failure.
Likely Root Causes
Inadequate server cooling or airflow around the disk bay
Failed or degraded cooling fans
High ambient temperature in the data center
Sustained heavy workload with insufficient cooling
Diagnostic and Remediation Steps
Identify the affected disk from the alert labels (
instanceanddevice).Check current and historical temperatures:
smartctl -a /dev/<device> | grep -i temperatureCheck the server’s fan speeds via IPMI:
ipmitool sdr type FanInspect airflow paths for obstruction. Verify that the disk bay isn’t blocked.
If ambient temperature has risen, escalate to facilities.
SmartctlDiskUncorrectableSectorsGrowing
This alert fires when a SATA drive’s Offline_Uncorrectable (attribute
198) grew over the last 24 hours. A stable non-zero count is harmless
because those sectors represent already-acknowledged bad blocks. Ongoing
growth means the drive is finding new sectors it can’t recover during
background scans, indicating confirmed unrecoverable data loss in newly
affected LBAs.
Likely Root Causes
Physical damage to platters
Severe NAND wear
Mechanical shock
Diagnostic and Remediation Steps
Identify the affected disk from the alert labels (
instanceanddevice).Determine which files (if any) live on the affected sectors:
smartctl -a /dev/<device>Check filesystem integrity (offline if necessary):
fsck -nv /dev/<device>Migrate any data off the disk and replace it. Don’t return the drive to service.
SmartctlDiskUnhealthy
This alert fires when a disk fails its SMART overall-health
self-assessment (smartctl_device_smart_status == 0). The drive
firmware predicts imminent failure. Replace the disk immediately to
prevent data loss.
Likely Root Causes
The disk has exceeded its rated endurance
Reallocated, pending, or uncorrectable sector counts crossed the manufacturer’s critical threshold
Catastrophic hardware failure or firmware corruption
Diagnostic and Remediation Steps
Identify the affected disk from the alert labels (
instanceanddevice).Verify SMART health and review all attributes:
smartctl -H /dev/<device>
smartctl -a /dev/<device>
Migrate data immediately to a healthy replica. Don’t defer.
Order an emergency replacement; don’t wait for a maintenance window.
SmartctlDiskWearoutCritical
This alert fires when an NVMe drive reports more than 90% of its rated
endurance used (smartctl_device_percentage_used > 90) sustained for
at least 15 minutes. At this wear level the manufacturer considers
near-term failure likely. SmartctlDiskAttributeFailing covers SATA
drives instead, since they expose wear via vendor-specific normalized
attributes rather than percentage_used.
Likely Root Causes
The disk has been in heavy write workloads for an extended period
A workload exceeded the disk’s rated endurance (write amplification)
The disk is approaching end of its rated lifetime
Diagnostic and Remediation Steps
Identify the affected disk from the alert labels (
instanceanddevice).Confirm the wear level:
smartctl -a /dev/<device> | grep -i percentage_usedReview workload sizing. If the workload exceeded the disk’s rated endurance, plan a higher-endurance class for the replacement.
Order a replacement. Schedule replacement during the next maintenance window, sooner if
SmartctlDiskUnhealthyalso fires.
SmartctlDiskWearoutWarning
This alert fires when an NVMe drive reports more than 75% of its rated
endurance used (smartctl_device_percentage_used > 75) sustained for
at least one hour. The drive still operates within specification but is
approaching end of life. Suppressed automatically when
SmartctlDiskWearoutCritical fires for the same disk.
SmartctlDiskAttributeFailing covers SATA drives instead.
Likely Root Causes
The disk has been in heavy write workloads for an extended period
A workload exceeded the disk’s rated endurance (write amplification)
Diagnostic and Remediation Steps
Identify the affected disk from the alert labels (
instanceanddevice).Check the wear trend in Grafana or Prometheus to estimate time to failure.
Plan a replacement during the next scheduled maintenance window.